Debugging and Optimization
Typically, when identifying problem areas, follow this troubleshooting process:
- Bidirectional packet reception rate of the anchor link: The bidirectional packet reception rate should remain stable at 85% or higher
- Ranging performance of the anchor link: If significant ranging errors are observed while the bidirectional packet reception rate is normal, the following may be the cause:
- Fixed obstructions between anchors: As long as the obstruction is at a certain distance from the anchor, the impact on positioning is usually minimal
- Errors in anchor coordinates: These must be corrected; otherwise, significant positioning errors will occur
- No obvious obstructions: If mounted on walls or metal surfaces, severe multipath may occur, significantly affecting positioning
- Incorrectly installed anchors: Check if neighboring anchor links also exhibit abnormal ranging; this may indicate mixed-up installations. Verify by checking for flashing lights
- Anchor coordinate error: Coordinate errors must be kept within 5% of the anchor distance; for one-dimensional zones, keep them within 2% whenever possible, otherwise zone transitions may fail
- Anchor-to-tag signal reception: Within a zone, signals from surrounding anchors should always be received. If no signals are received, positioning performance will inevitably deteriorate
- Tag parameter issues:
- Height above ground: Should be roughly close to the actual height at which the tag is used; the larger the error, the greater the impact on positioning
- Height noise: Represents uncertainty in the height direction. Assuming the tag generally moves within a range of 1–2 m, it is recommended to set the height above ground to 1.5 m and the noise to 0.5 m
- Acceleration: Set based on the actual target’s mobility. Higher acceleration results in lower latency but greater jitter.
- Filtering time: Refers to smoothing using data from the most recent points. This introduces a fixed delay; a larger window yields a smoother trajectory but greater latency.
- Constraint area settings: If the constraint area settings deviate significantly from reality, it will actually increase errors, as this effectively introduces incorrect assumptions.
- Relative Positioning Between Multiple Maps: Pay particular attention to ensuring the relative coordinate relationships between maps are correct; otherwise, it is equivalent to having anchors with incorrect coordinates, which significantly impacts positioning
- Tag Hardware Issues: If most other tags are functioning normally, the issue may lie with individual hardware components. For battery-powered tags, check if the battery level is too low
- Insufficient Computer Performance: Low battery power or inadequate computer performance can cause the software to run slowly, potentially leading to abnormal results
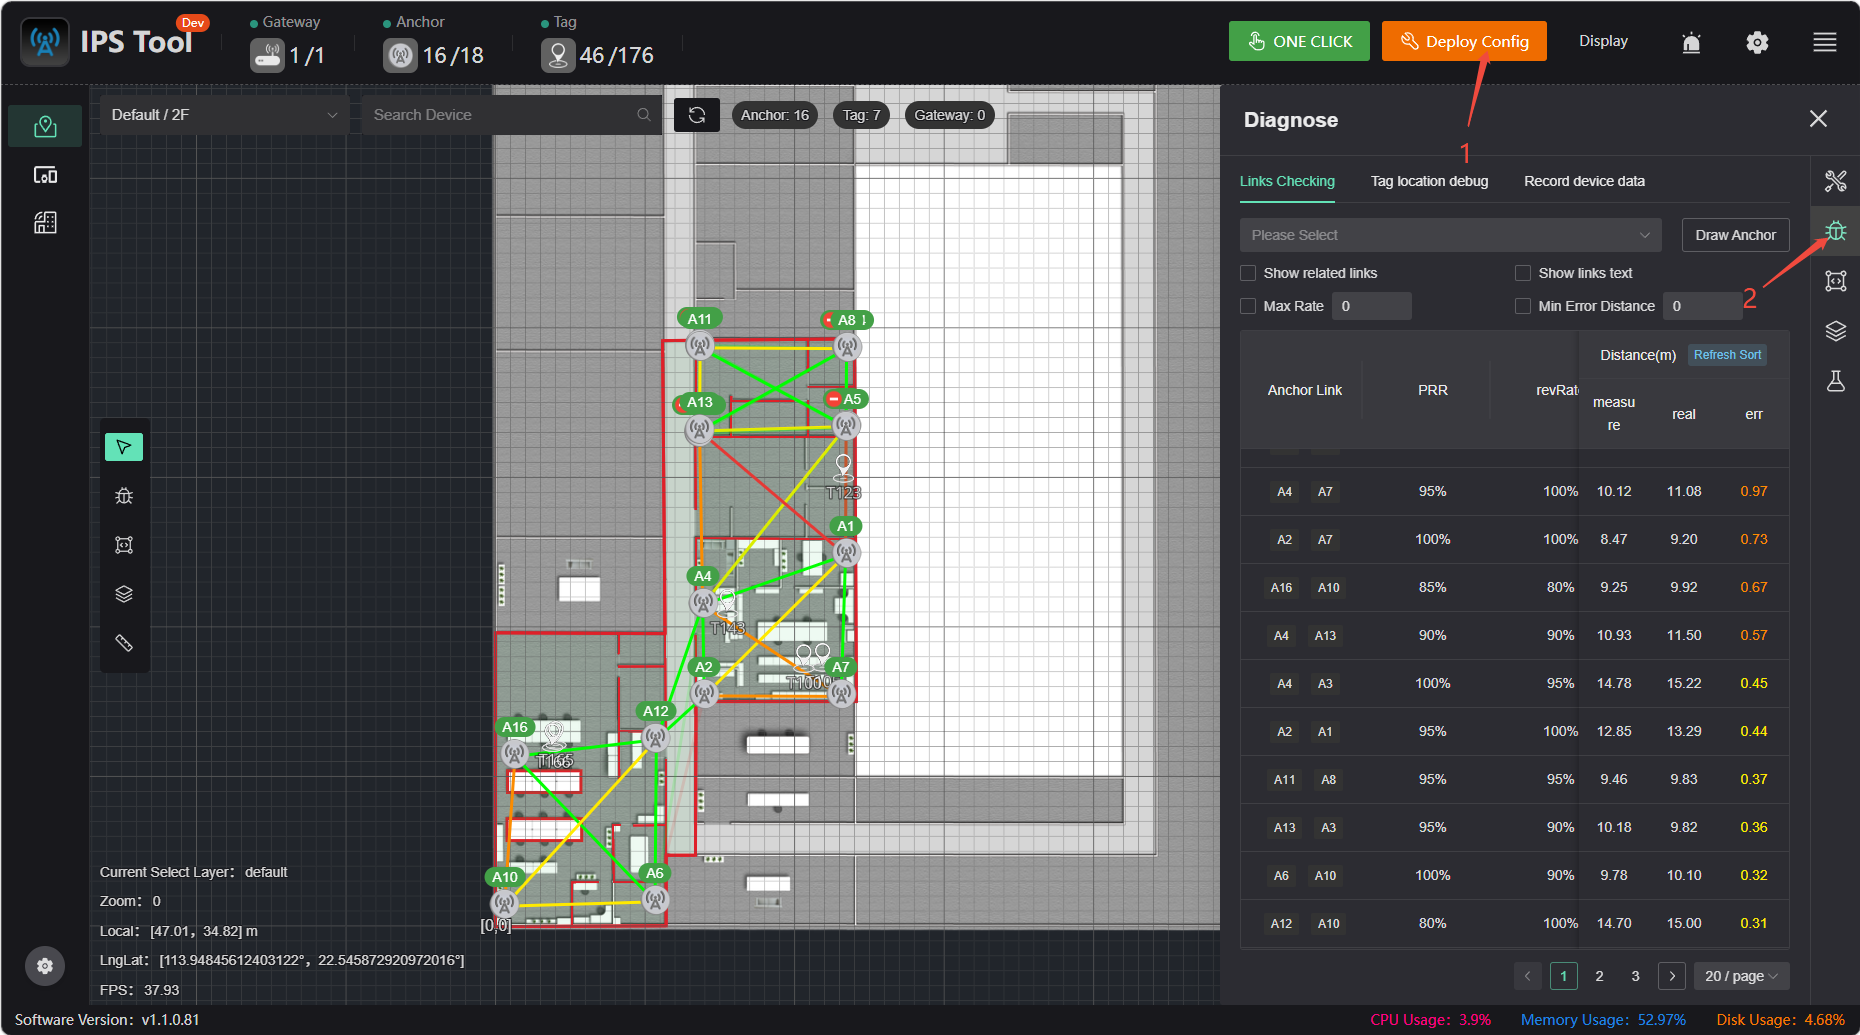
Checking Anchor Link Status
- Transparent lines indicate unconnected links
- Color indicates ranging error; the redder the color, the greater the error
- The right side displays specific link information, including bidirectional packet reception rates and ranging-related data
- Errors should be minimized as much as possible; a bidirectional packet reception rate consistently above 85% is optimal, otherwise positioning accuracy may be compromised
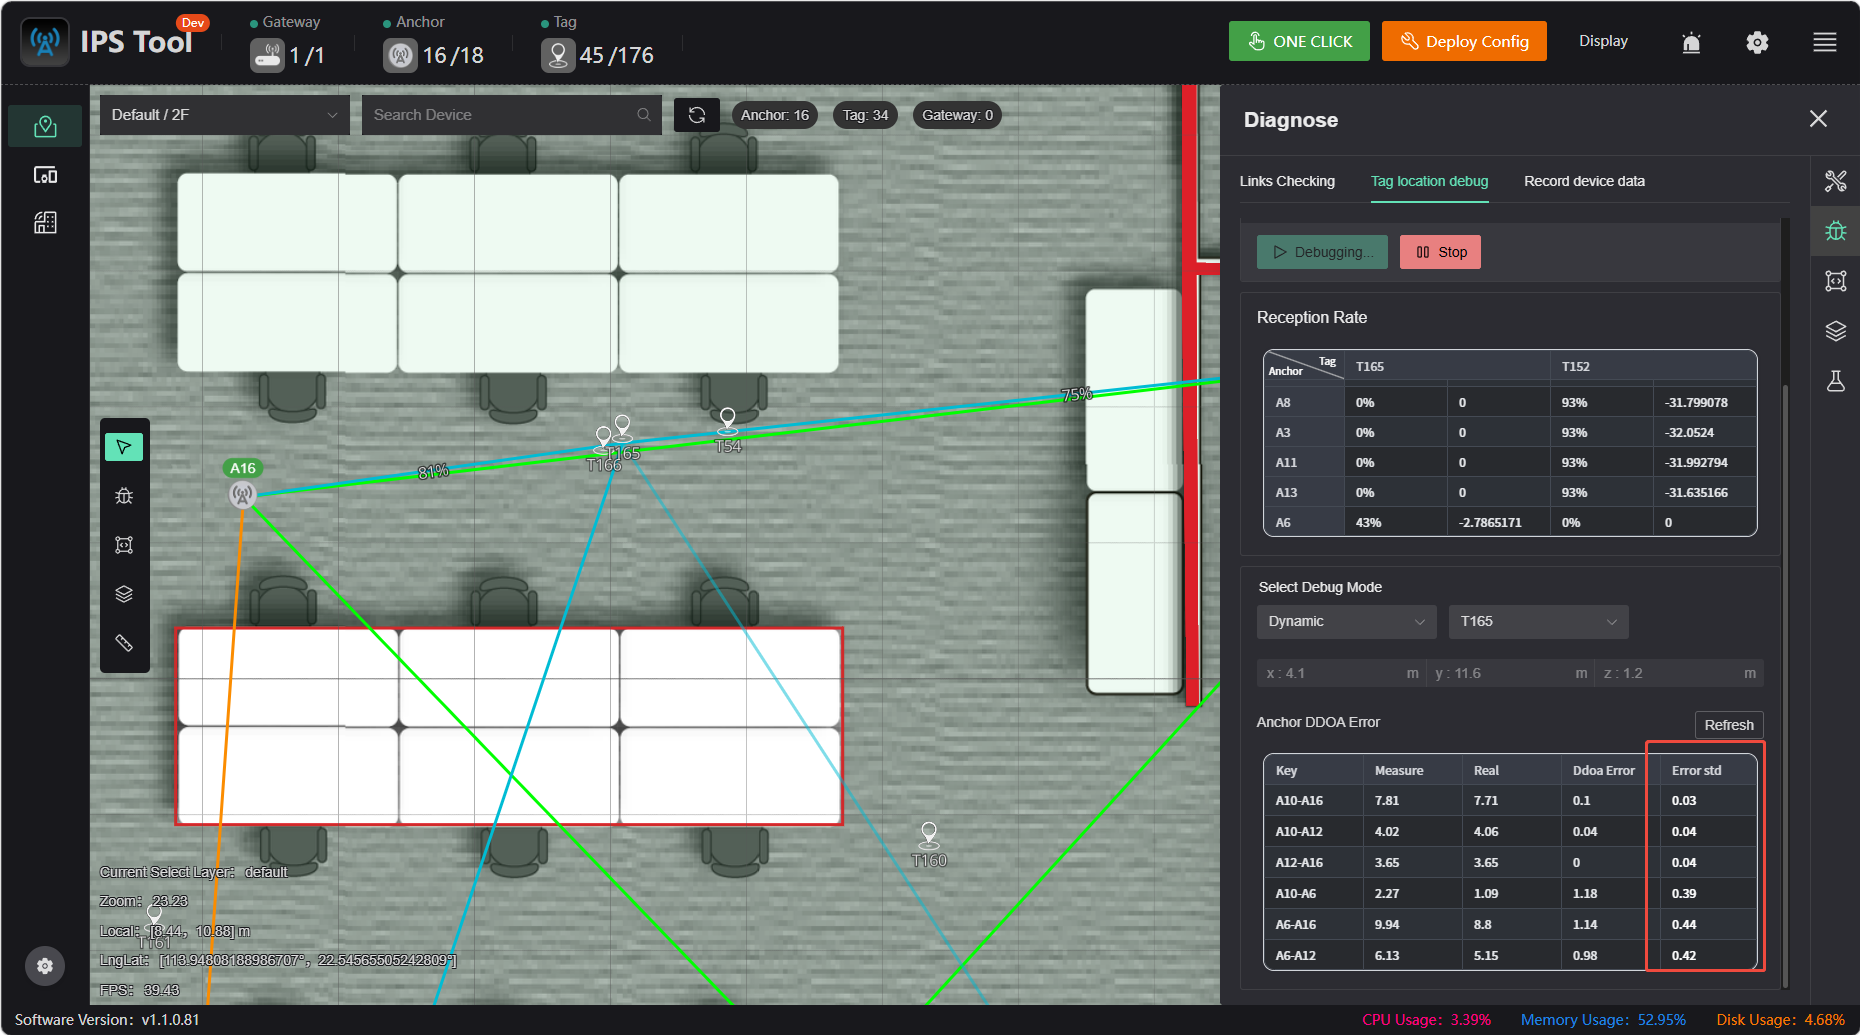
Checking Signal Reception from Anchors to Tags
Switch to the Tag Positioning Debug tab, select the anchor you want to observe, and start debugging.
Generally, if there are no other errors and the packet reception rate is normal, positioning works correctly. However, anomalies may occasionally occur. You can check the DDOA error to further determine which anchor might be causing the issue. Possible sources of the problem include:
- Obstruction between the tag’s current location and the anchor
- The anchor’s location is prone to multipath
- Other sources of error related to the anchor
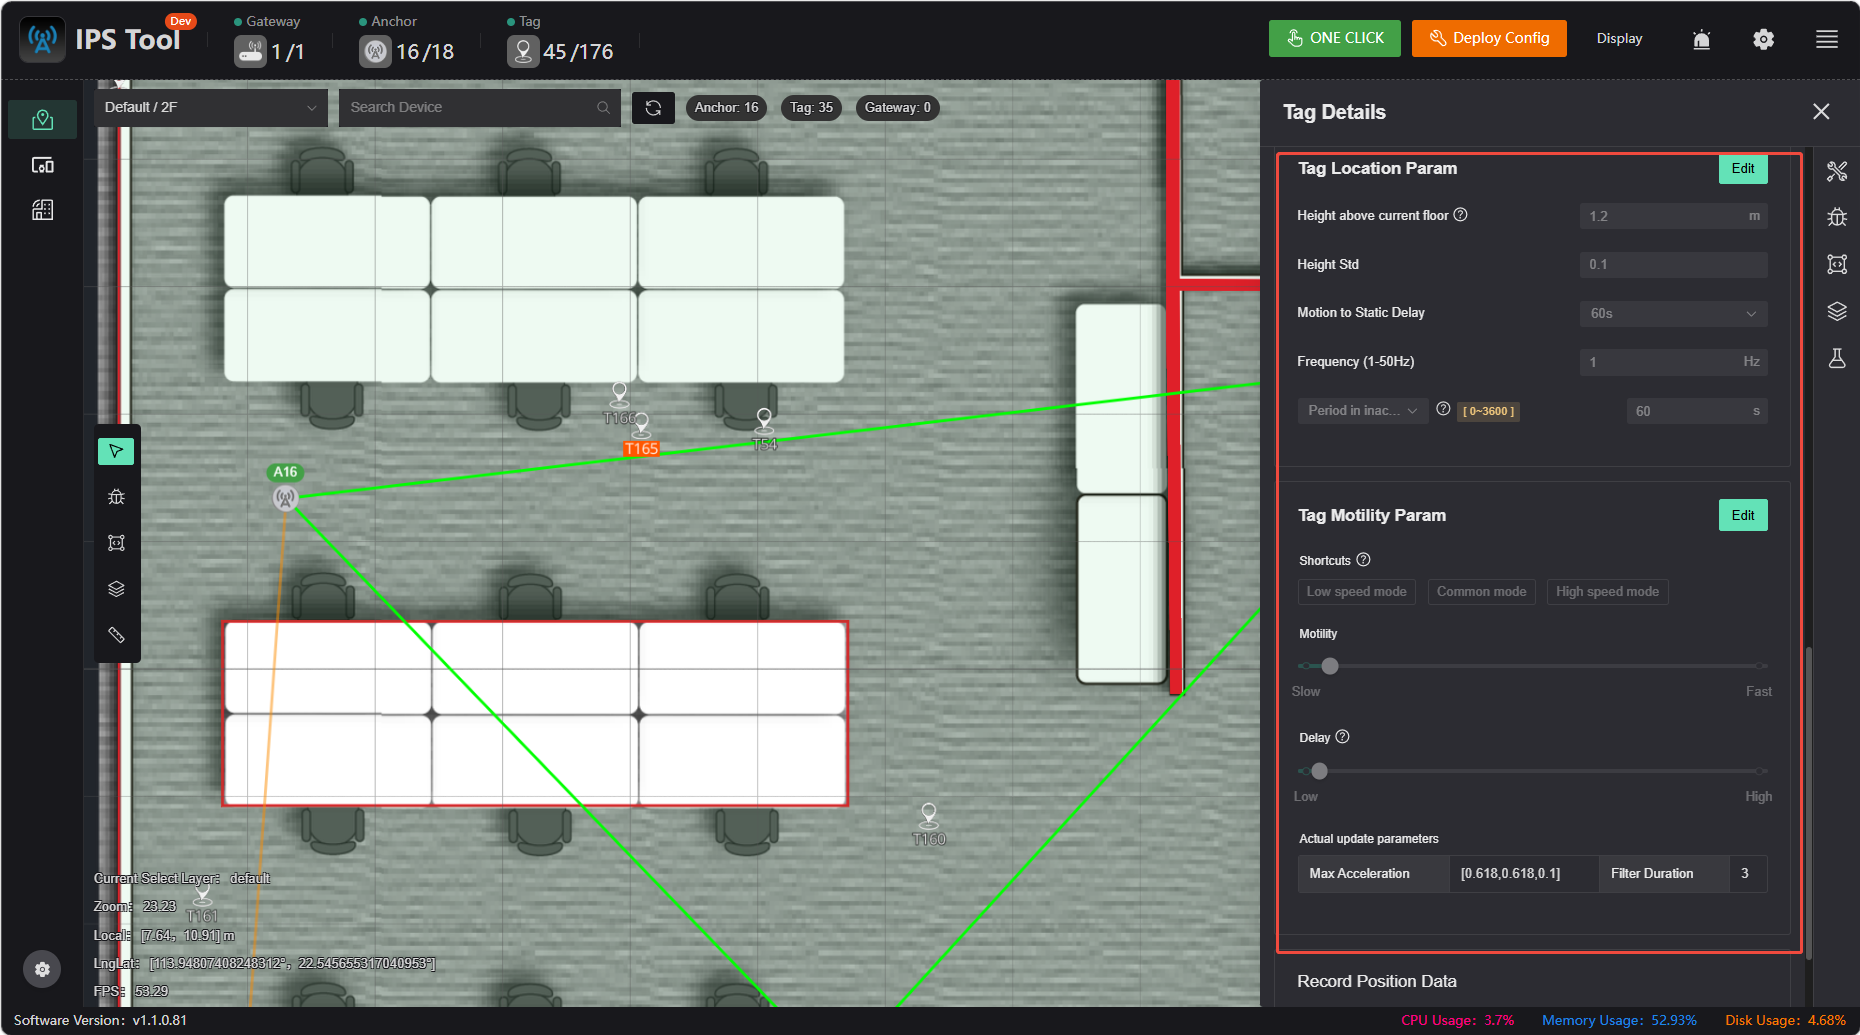
Checking Label Parameters
Click the label icon on the chart to configure label parameters in the information panel on the right. For detailed descriptions and instructions on modifying parameters, see Tag Parameter Configuration
Performance Optimization Methods
If the results still fall short of requirements after performing the troubleshooting steps above, further optimization can typically be achieved using the following methods:
- Optimize tag placement: For personnel tracking, safety helmets > wristbands > ID badges
- Optimize anchor placement:
- The higher the anchor, the less the signal from the tag is affected by obstructions
- The closer the aspect ratio is to 1, the better the performance
- Within the communication range, the greater the distance between anchors, the smaller the relative error and the better the positioning accuracy
- Add more anchors: In theory, the higher the anchor density, the higher the positioning accuracy