NAssistant for TOFSense
When using NAssistant,A separate TOFSense sensor needs to be connected to the host computer using a USB to TTL converter. It cannot be used in CAN, IIC mode, or cascade state.

Main Interface
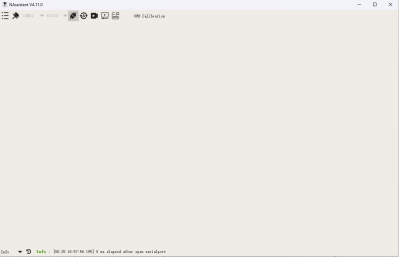
By default, the interface of NAssistant is blank when it is opened. The corresponding interface will be displayed only after the user connects the module using USB to TTL and recognizes it. The following figure shows the interface when the host computer does not recognize it.
Menu

Click to display the following options. It is generally not recommended to modify them, so just keep the default settings.
- Enable 3D:
- Automatically connect to the serial port: After it is turned on, each time you open the NAssistant host computer, it will automatically connect to the COM port with the smallest serial number. If the user's computer has a virtual serial port or Bluetooth, it is not recommended to turn on this option. It is recommended to manually select the corresponding COM to connect.
- Automatically identify devices: When this option is turned on, the device will be automatically identified after connecting to the serial port. If this option is not checked, you need to manually click the identification button when connecting to the serial port.
- Value refresh: refresh data interval, default is 100ms.
- Chart refresh: Chart refresh interval, default is 33ms.
- Maximum memory usage: The default is 300M. It is generally not recommended to modify it unless the user has special needs.
- Check for software updates: Software Update.
- Open Data Folder: Opens the data folder.
- Language: Modify the language of the host computer.
- Enable function: Enable function.
Serial Port Debugging Assistant

The host computer needs to select the corresponding serial port and baud rate for communication with TOFSense, so the NAssistant host computer has a serial port debugging assistant integrated inside. Click the serial port debugging assistant to open the corresponding interface. The serial port parameter settings are as follows.

| DataBits | StopBits | Parity | FlowControl |
|---|---|---|---|
| 8 | 1 | NoParity | NoControl |
Connect

When the icon is plugged in, click this button to disconnect the current serial port. When the socket is disconnected, click this button to connect to the corresponding serial port. If automatic identification is checked, automatic identification will start.
If the connection fails, as shown in the figure below, it means that the serial port may be occupied or the serial port driver is not installed properly. If there are other applications occupying the serial port in the background, you need to close it and try again.(This problem will also occur if two NAssistants are opened at the same time to connect to the same serial port, so you need to close one).

Serial Port

After correctly installing the serial port driver and selecting a working USB to TTL converter, the user can find the USB to TTL port number in the port in the device manager. If the user also has other serial port devices or virtual serial ports connected to the device, there will be many COM ports. At this time, the user can unplug and plug the USB to TTL converter to see the port number change. At this time, the user can select the corresponding port number.
Recognize

After clicking, the host computer will identify the TOFSense module in UART mode automatically. If TOFSense is in IIC, CAN or cascade mode, the identification will fail. At this time, you need to change the module to UART mode according to the operation in the corresponding manual FAQ and then identify it.
Record, Playback, and Export Data
NAssistant provides convenient data recording, playback and export functions.
DataRecording

The user can click the record button on the main page menu bar at any time to start real-time raw data recording. Clicking the button again will stop recording and output a *.dat file (the recorded data is the data received by the NAssistant software during the period between clicking the record button twice).
DataReplay

You can click the playback button to open the default storage path to extract the recorded *.dat file and send it to after-sales engineers to troubleshoot the problem, or load the recorded historical data. The software is equipped with a playback control bar to adjust the playback rate, progress, etc.
EXportData

In real-time or playback mode, you can click the Export button to start exporting text data to a local .xlsx file. Clicking the button again will stop the export and automatically open the folder where the file is located (if the folder is not opened automatically, follow the log prompt in the lower left corner of the software main page to find the folder with the corresponding path for extraction, or click the menu button, click Open Data Folder, and search in the "export_data" folder.), which can be used for subsequent data analysis (the exported data is the .dat data received or played back by the NAssistant software within the time between clicking the Export button twice).
Site

The setting button will appear only after recognition. Click the button and the setting interface will pop up, as shown below.
TOFSense/-UART/S/F/F P/F2 Mini/F2/F2 P/F2 PH:

TOFSense-M/MS:

Read parameters: Read the parameters of the current module.
Write parameters: Write the parameters of this page into the module. Modifying the parameters on this page will be invalid and you need to click Write to make them effective.
It should be noted that before changing to CAN, IO, or IIC mode, the host computer will fail to recognize the module after the change. The module needs to be changed to UART according to a specific method before it can be used again. The specific method is in the FAQ of each user manual.
Query Mode Test
The TOFSense series modules are in UART active output mode by default. The module will automatically report data at a specific frequency. In query mode, the module will not actively output any data. The user needs to send a specific query to obtain data. The following figure shows how to query the module data in the query mode with ID 2.

Firmware Update
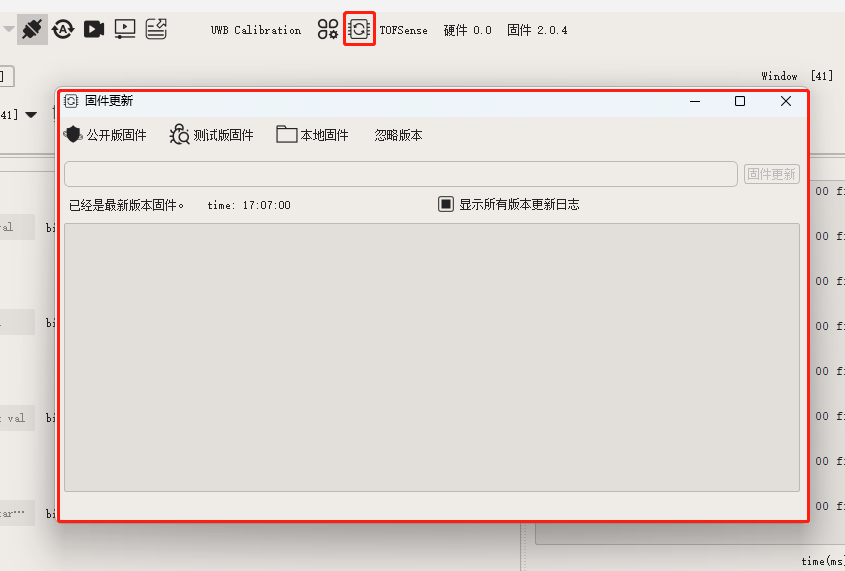
Some models support remote firmware updates. It is not recommended to update the firmware unless necessary during normal use. If necessary, please contact official technical support.
Data Page
After the module is identified, if the user is using it for the first time, the Data interface will be automatically displayed as follows.
TOFSense/-UART/S/F/F P/F2 Mini/F2/F2 P/F2 PH:

On the left side of the interface are simple mathematical calculations provided for user testing, and on the right side are the original data and the parsed data.
TOFSense-M/MS:

For the more special TOFSense-M/MS module, its data interface is shown in the figure above. The left side is a simple mathematical calculation, the middle is the raw data, and the right side is a 3D bar graph generated from the raw data. The upper figure is the generation of the ranging value, and the lower figure is the generation of the signal intensity corresponding to the ranging value. The data points in the two figures are at the intersection of the XY axis.
Why does my histogram appear flat? By default, the interface displayed when you use NAssistant for the first time is a top view. The bar chart can be changed by placing the mouse on the bar chart and then holding down the right button to drag the bar chart.

The abbreviation meaning of the left parameter:
| time | dis | dis_status | signal_sterngth | range_precision |
|---|---|---|---|---|
| Power-on time | Distance | Status for distance | Signal strength | (F series unique parameters) |
At the same time, the NAssistant host computer provides simple mathematical calculations to facilitate users to test TOFSense. For example, after checking dis in the above figure, the following mean (average), std (standard deviation), max (maximum), min (minimum), half (median) and other data begin to refresh, and their value range is related to the line page.
The mathematical calculations here suggest that the user use it when the module is stationary and irradiates a sufficiently large object.
Line Chart Interface

NAssistant provides a line graph visualization interface for the ranging sensor to facilitate user debugging and use. On the Line page, the vertical axis represents the ranging value, and the horizontal axis represents the number of data points. The mathematical calculations on the Data interface are calculated using these data points on the horizontal axis. For example, if the horizontal axis is set to 500, it means that a maximum of 500 ranging values can be accommodated. Check the left side for the data to be refreshed on the line graph.
Line Chart Settings
Place the mouse on the line chart, right-click to zoom out the current view, hold down the left button and drag the mouse to zoom in the selected view. If the view is zoomed in and the data cannot be seen, you can adjust it by setting the Axis Min and Axis Max of the Y axis and set the corresponding TOFSense to 0 and 10 respectively.
